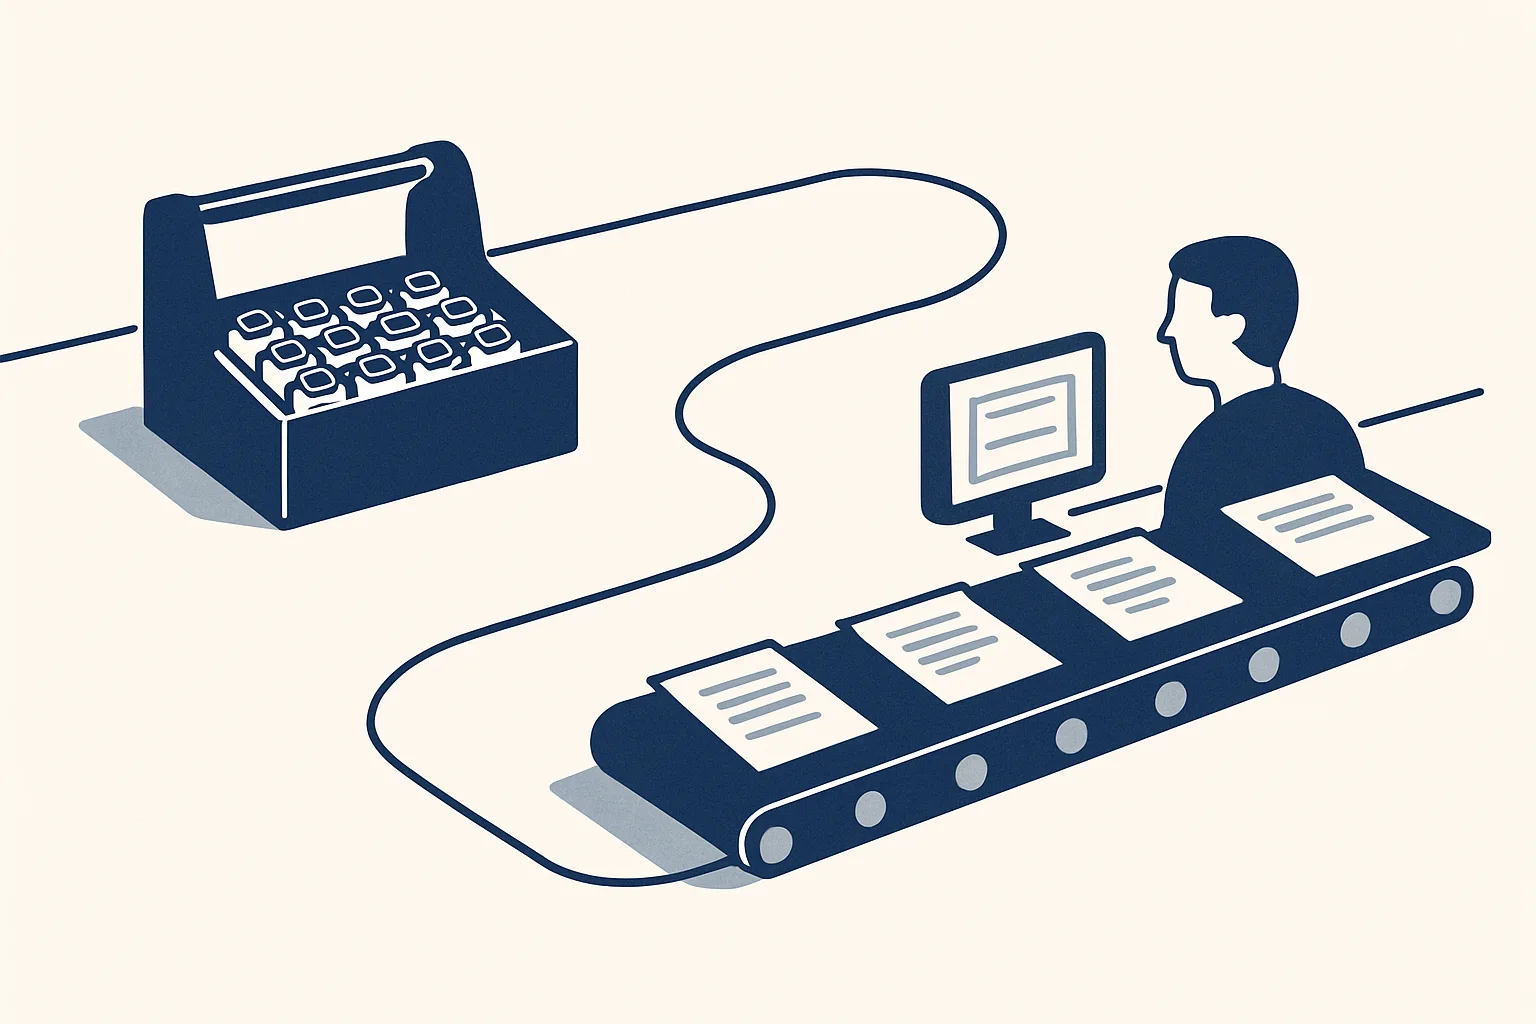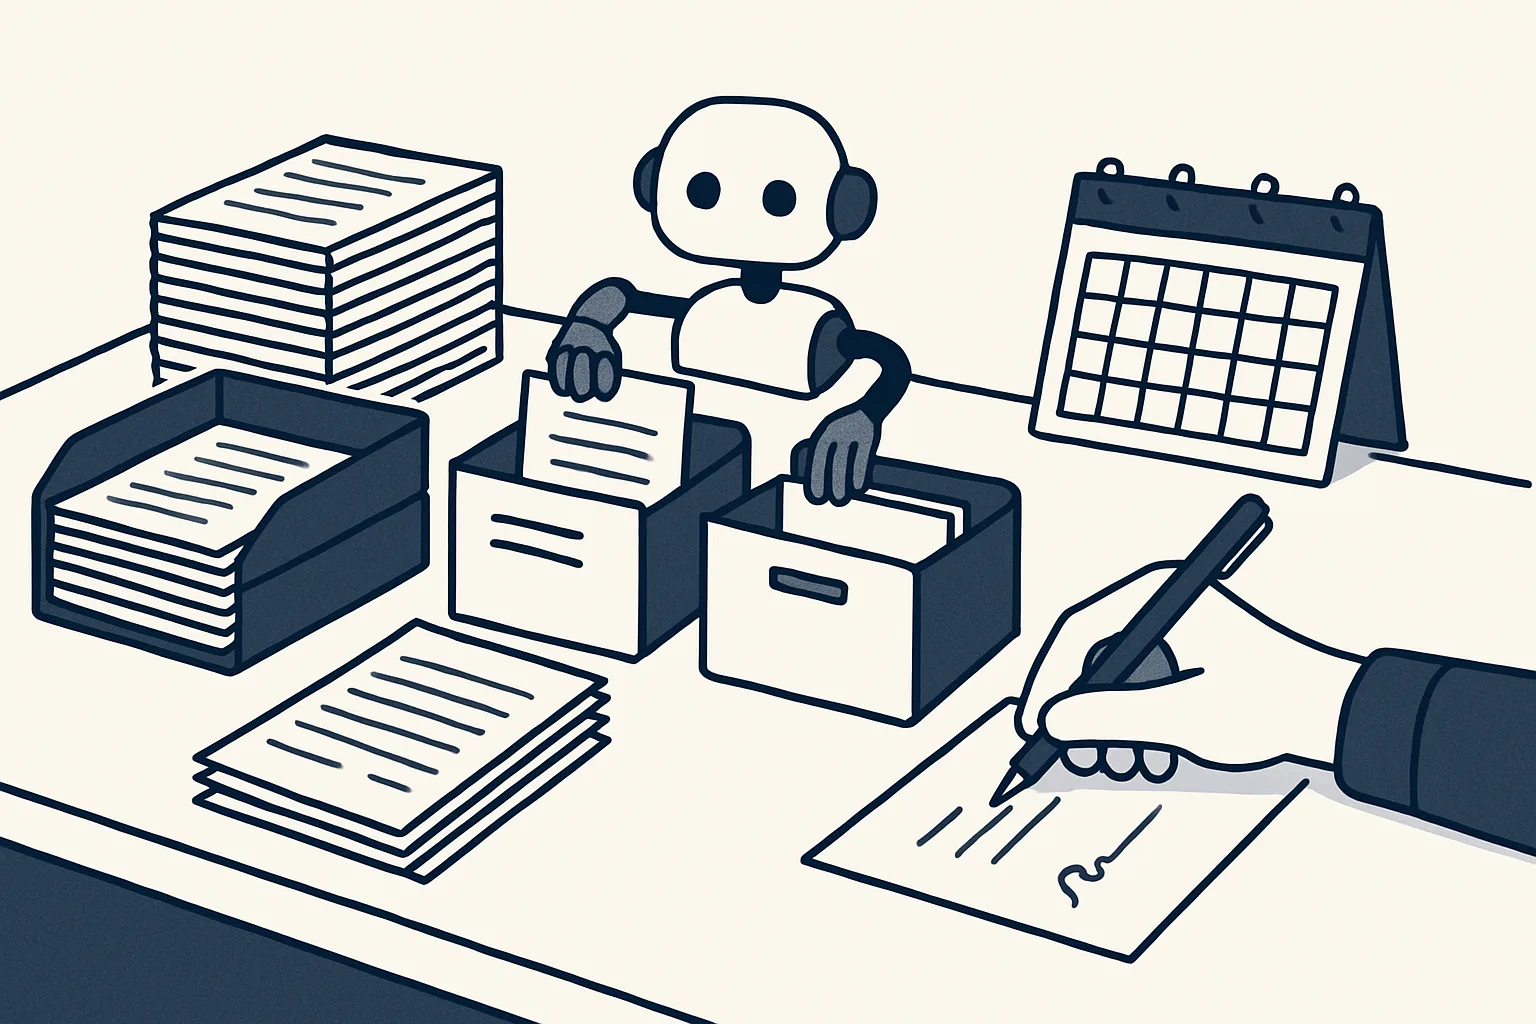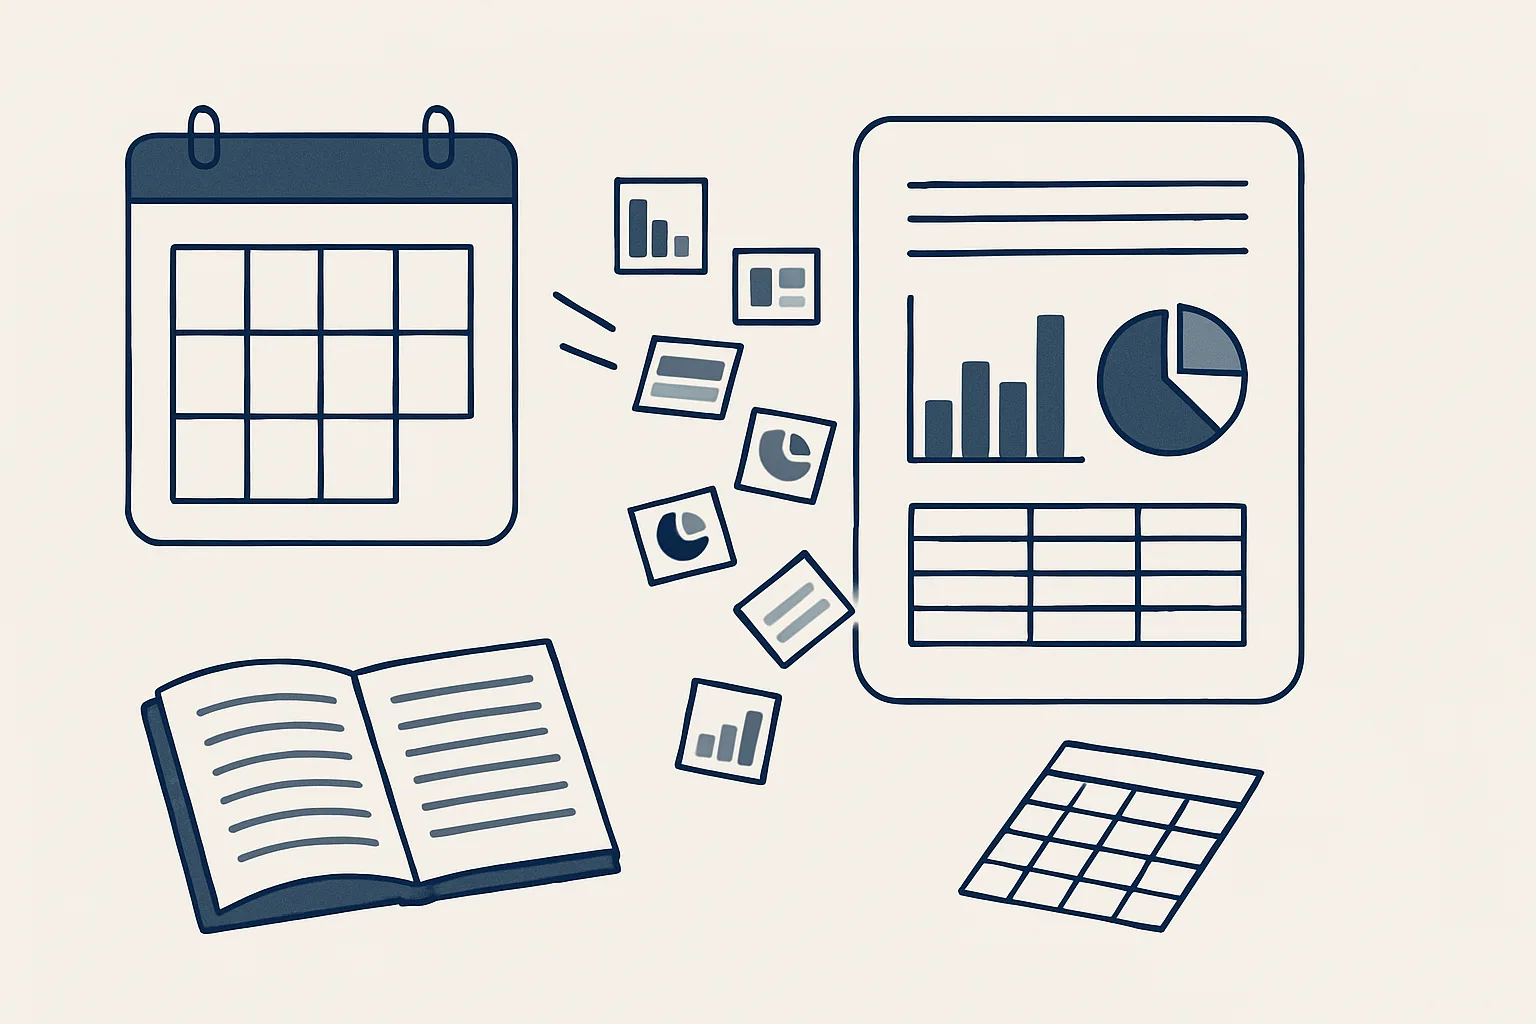
Automated reporting gathers the same figures from your sheets, accounting system and mailbox on a schedule and builds the report you would otherwise build by hand. Every number links back to its source, and a person checks the report before anyone acts on it.
Reports worth automating
Automated reporting is worth it for any report you build on a fixed schedule, from the same sources, in the same layout, every time.
Most businesses have at least one. A weekly sales summary pulled from the accounting system. A Monday list of overdue invoices. A monthly view of supplier spending. A report for partners on open jobs. Each one takes someone an hour or more of exporting, copying, pasting and formatting, and each one is built the same way as last time.
That sameness is the signal. If you could write the instructions for the report on a page, such as 'take these totals from here, compare with last week, list anything over this amount', the report can be assembled automatically. If it needs fresh thinking every time, automation can still gather the figures, but the commentary stays with a person.
Some reports are poor candidates: one-off analyses, board papers that are mostly argument, or anything built from sources nobody has written down. Start with the routine ones.
We already run one example of automated reporting today: a daily mail digest that, every morning, lists the previous day's new and unanswered emails across all the mailboxes of a group of companies, sorted by business, each with a short gist. Custom reports and dashboards on your own figures are offered and built to order.
Sources and refresh
Every automated report starts with a list of sources and a refresh schedule: where each figure comes from and how often it is read.
Getting the sources right is most of the work in automated reporting. A report built on the wrong sheet, or on a sheet two people edit differently, will be wrong every week, however neatly it is laid out.
Typical sources are the accounting system, the sheets the team keeps up to date, the mailbox and shared folders. Each one has its own rhythm. Accounting figures may change throughout the day; a register in a sheet may be updated weekly; a mailbox changes by the minute.
Decide the refresh by the decision the report supports. A weekly management report needs a reading early on the day it is used, not a live feed. A list of overdue invoices for a morning call needs that morning's figures. Reading more often than needed adds noise and makes figures appear to move while people are discussing them.
Write down a cut-off for each report, for example 'figures as at the close of the previous working day', and print it on the report itself. Everyone then knows exactly what period the numbers cover.
| Source | Typical figures | Sensible refresh |
|---|---|---|
| Accounting system | Sales, overdue invoices, supplier spending, bank balances | Once, at the report's cut-off |
| Team sheets and registers | Open jobs, orders, stock, enquiries | When the report is built |
| Mailbox | Unanswered emails, new enquiries, documents received | Daily, at a fixed time |
| Shared folders | Documents filed, missing documents | When the report is built |
| Price history register | Last price per product, changes over time | After new invoices are read |
Structure of a good weekly report
A good weekly report answers a handful of fixed questions in the same order every week, with the exceptions first and the detail last.
Readers want to know quickly whether anything needs their attention. Put that at the top: the few items that are late, unusual or above a limit. Below it, the standing figures that show how the week went, compared with the week before. Detail comes last, for anyone who wants to check.
A reliable layout for most small businesses looks like this:
- Needs attention: items late, missing or outside agreed limits, each with its source.
- The week in figures: the standing totals, compared with the previous week.
- Money in and out: invoices issued, payments received, bills entered and due.
- Open work: orders, jobs or enquiries still waiting, and who they are waiting on.
- Changes: new customers, new suppliers, price changes.
- Detail: the lines behind each total, linked to the documents.
Linking numbers to sources
Every number in an automated report should link back to where it came from, so anyone can check it in one step.
This is what makes automated reporting trustworthy. A figure without a source has to be taken on faith, and the first time one turns out wrong, people stop trusting the whole report and go back to building it by hand. A figure with a link to the invoice, the sheet row or the email it came from can be checked in seconds.
When people say automated reporting did not work for them, the cause is usually here: totals appeared with no way to check them, one was wrong, and trust went with it.
Linking also exposes gaps. If a figure cannot be traced to a single source, the report has found a real problem: two sheets that disagree, a document never filed, an entry made without its paperwork. That finding is often worth more than the report itself.
The same principle runs through the rest of our work. Every action a robot takes is written to a log, and anything it cannot do exactly goes to a person instead of being guessed. For reports, that means a figure the robot cannot source is shown as missing, not estimated.
Is your manual report ready to automate?
Think of one report you build by hand on a schedule. Tick each statement that is true of it today.
Delivery: dashboard or document
Deliver the report as a document when it supports a regular meeting, and as a dashboard when people need to look things up between meetings.
A document, such as a PDF or a sheet tab, is a snapshot. It records what the figures were at the cut-off and can be filed, compared and discussed. It suits weekly and monthly reports, and anything that might need to be looked at again later.
A dashboard is a live view of the few numbers that matter to a business. A business dashboard more broadly shows open work, overdue items and recent activity. Dashboards suit questions that come up during the week, such as 'what is this customer waiting for?', but they change constantly, so they are a poor record of what was known at a given moment.
Many businesses end up with both: a dashboard on their own tools for daily use and a weekly document filed for the record. Custom dashboards, reports and custom CRM development on the client's own sheets and tools are offered and built to order. Our AI employees are rented monthly, run on our servers and read from the client's own accounts; the reports and dashboards stay in the client's own folders and sheets.
What automated reporting does not do
Automated reporting assembles and checks figures; it does not interpret them, decide what to do about them or fix the records they come from.
A report can show that overdue invoices rose this week. It cannot tell you whether to call the customer, extend their terms or stop supplying them. Those decisions need someone who knows the relationship. Where a short written commentary is wanted, a draft can be prepared from the figures, but a person reads it and rewrites anything that sounds wrong.
Nor does it clean up messy records on its own. If invoices are entered late or documents are filed in the wrong place, the report will reflect that faithfully. The upside is that automated reporting makes such problems visible every week, which is often the push needed to fix them at the source.
Finally, it does not replace your accountant's reports. Management figures built for a weekly meeting are a working view; statutory accounts and tax figures remain with your accountant, so check with your adviser before relying on any internal report for those purposes.
Approval first, then your choice
An automated report should go to the owner or manager first, who checks it before it is shared; later, trusted reports can be shared automatically.
Even a well-built report can be wrong for reasons outside its control: an invoice entered late, a sheet edited by mistake, a source that was offline at the cut-off. A short check catches these before anyone acts on them.
A simple checking routine for each run:
- The report is built at the cut-off and filed with the date in its name.
- The owner is told it is ready, with any missing sources listed at the top.
- The owner looks at the needs-attention section and opens two or three source links.
- If a figure is wrong, the source is corrected and the report is rebuilt, not edited by hand.
- Once approved, the owner shares it.
- Any recurring problem becomes a new rule in how the report is built.
Questions
What is automated reporting?
It is a report assembled by software on a schedule, from the same sources and in the same layout each time, instead of being exported, copied and formatted by hand.
What is the difference between a dashboard and a report?
A dashboard is a live view of a few key figures that changes as the data changes. A report is a snapshot at a cut-off that can be filed and compared later.
Can automated reports be wrong?
Yes, if a source is wrong or incomplete. Linking every number to its source and having a person check the report before it is shared catches most problems.
Do I need custom CRM development to get automated reports?
Not always. Many reports can be built from the accounts, sheets and mailbox you already use. A custom CRM or dashboard helps when the data you need is not recorded anywhere yet.
Will the robot email the report to my clients or partners?
Not at the start. Reports go to the owner or manager, who checks them and decides who receives them; trusted reports can be moved to automatic later.
Tell us your workflow. We will build it around you.
Write to [email protected] with the report you build by hand and the hours it takes each week, and we will tell you plainly whether it can build itself.
Talk to us Related service: CRM and dashboards