A business dashboard pulls the few numbers you check every week, such as sales, overdue invoices, open orders and cash, from the sheets and accounting system you already use, and refreshes them automatically. Start with five numbers and the question each one answers.
What a dashboard is for
A business dashboard is one screen that answers the handful of questions you ask about your business every week, using figures that update themselves.
Most owners already have the numbers somewhere. Sales are in the accounting system, open orders in a sheet, overdue invoices in an aged report, enquiries in the mailbox. The problem is not missing data; it is that answering a simple question, such as how much we are owed today, means opening three things and adding up by hand. A dashboard puts the answer in one place, every time you look.
That is also the test of a good one. If you look at a business dashboard and still have to open the accounting system to know what to do, it is decoration. If it tells you which invoice to chase, which order is late and whether cash will cover next week's bills, it is doing its job.
This guide shows how to choose the few numbers that matter, where each one comes from, how to keep them fresh without anyone copying figures by hand, and when a regular report serves better than a screen.
Choosing the five numbers
Start with five numbers, each tied to a question you actually ask and a decision it helps you make.
A dashboard of the numbers that matter fails most often by showing too many of them. Twenty tiles look thorough and get ignored. Five that you check every Monday get used. Write each one as a question first, then decide the figure that answers it, then name where that figure lives today. The table gives common choices for a small trading or service business; replace any of them with your own.
Two numbers deserve a definition before they go on any business dashboard. Overdue should mean past the due date and unpaid, not simply unpaid. Cash should say whether it is the bank balance as last recorded in the accounts or a live figure from the bank. A number without a definition will be read differently by every person who looks at it.
| Number | The question it answers | Where it usually lives |
|---|---|---|
| Sales this month against last month | Are we selling more or less? | Accounting system, sales invoices |
| Overdue receivables | Who owes us, and how late are they? | Accounting system, aged receivables |
| Bills due in the next two weeks | What must we pay soon? | Accounting system, supplier bills |
| Open orders | What have we promised and not yet delivered? | An order sheet or register |
| Cash in the bank | Can we cover what is due? | Bank balance, as recorded in the accounts |
| Open enquiries | Which prospects are waiting for an answer? | An enquiry register or the mailbox |
| Margin on recent sales | Are we pricing well? | Sales invoices against purchase prices |
Where the data comes from
Every number on a dashboard should come from a system you already keep up to date, never from a separate copy someone has to maintain.
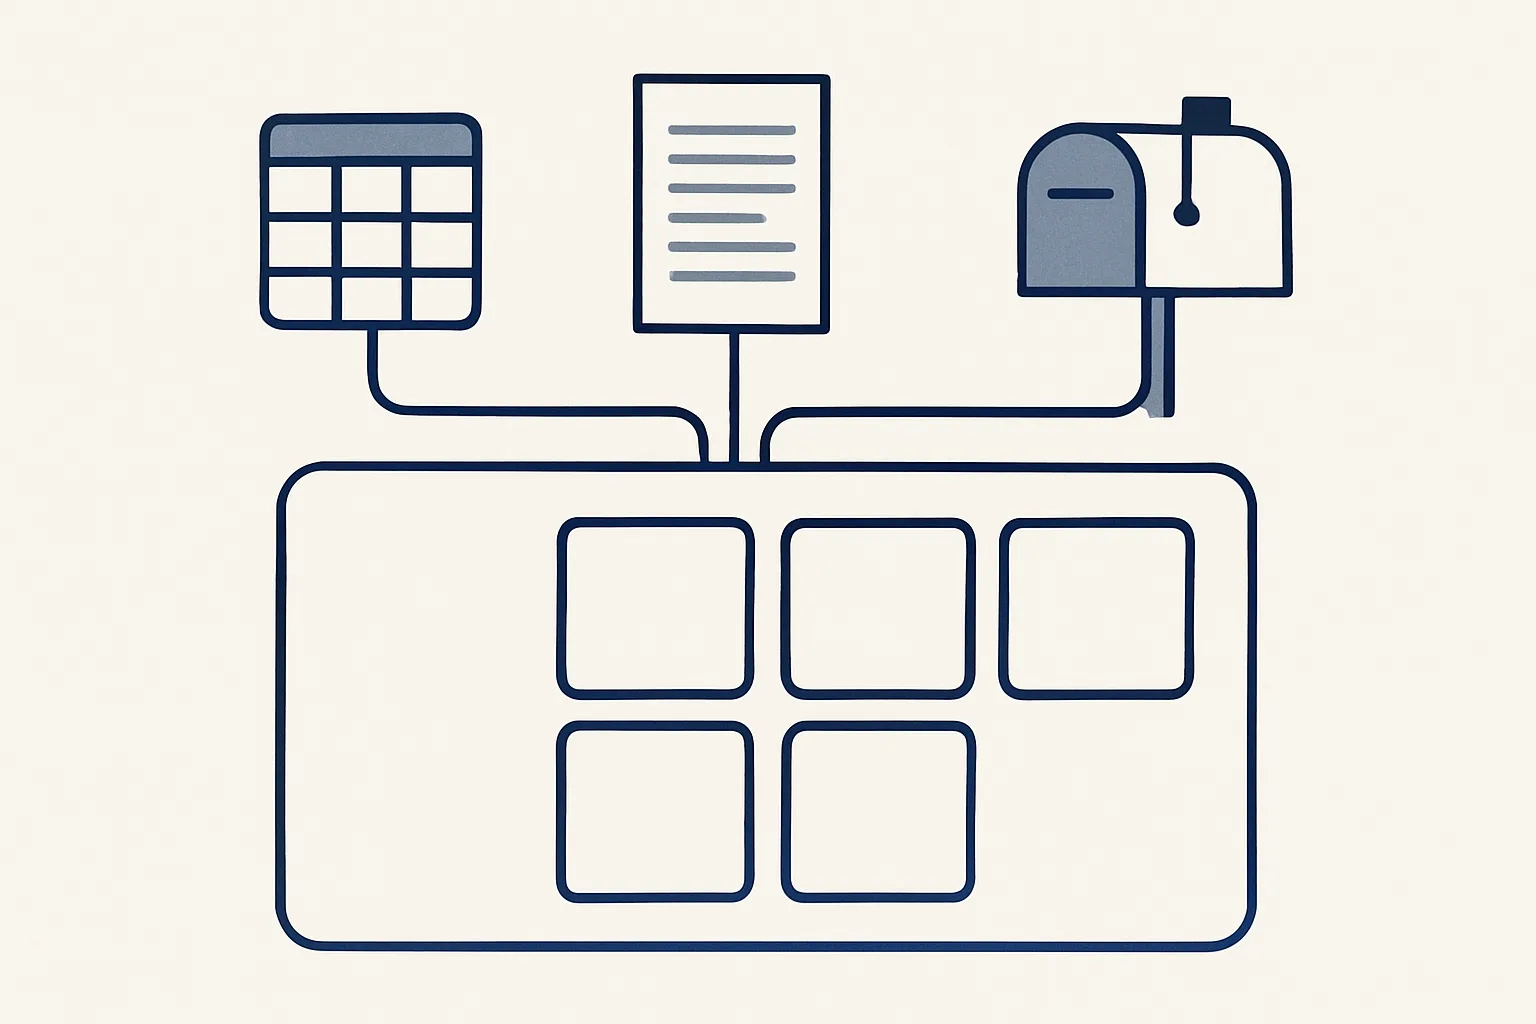
The rule matters because a dashboard fed by a spreadsheet someone updates on Fridays is a dashboard that is wrong from Monday to Thursday. Look for the source that is already maintained as part of the work: the accounting system, because invoices and bills are entered there anyway; the order sheet, because the team fills it to do the job; the mailbox, because enquiries arrive there first. Typical sources for a small business:
- The accounting system: sales, receivables, payables, bills due and recorded bank balances.
- Order or stock sheets: open orders, deliveries due, what is in stock.
- Registers kept by robots: for example a price history of every product line bought and sold, with its unit price, kept up to date from invoices.
- The mailbox: counts of new and unanswered emails, or open enquiries logged from it.
- Task lists: what is waiting, and for whom.
- Anything kept by hand that is not maintained as part of the work should be fixed at the source before it goes on a dashboard.
Is your dashboard ready to build?
Think about the dashboard you want. Tick each statement that is true today.
Refreshing automatically
A dashboard refreshes automatically when each number is read from its source on a schedule and the screen is rebuilt from those readings, with no copying by hand.
The mechanics are simple to describe. A small program reads each source with read-only access, calculates the figures, writes them to a sheet you own and redraws the screen. If a source cannot be read, the tile says so instead of showing an old figure as if it were current. How often depends on the number: cash and overdue invoices may be worth reading every morning, sales once a day, margins once a week. Refreshing more often than you look adds nothing. A typical refresh runs like this.
- At a set time, or when a source changes, the refresh starts.
- It reads each source with read-only access: the accounting system, the order sheet, the registers.
- It calculates each number exactly as defined, such as overdue meaning past the due date and unpaid.
- It writes the figures, with the time of reading, to a sheet in your own account.
- The dashboard redraws from that sheet; any source that failed shows as not updated.
- Every refresh is written to a record, so a strange figure can be traced back to its source.
Dashboards versus reports
A dashboard is for looking up the current state whenever you want; a report is for being told, on a set day, what changed and what needs attention.
Both have a place. Automated reporting suits people who will not open a dashboard but will read an email or a message: a weekly summary of sales, overdue invoices and bills due, delivered on Monday morning. A dashboard suits people who check often and want to drill into a figure. Many owners need a short report that points to the dashboard for detail.
A good example of the report side is one we run today for a client: a daily mail digest. Every morning it lists the previous day's new and unanswered emails across all the mailboxes of a group of companies, sorted by business, each with a short gist and the full text one tap away. In the same spirit, our client app shows a page per client with what is waiting for whom. Neither is a financial dashboard, but both answer a daily question without anyone assembling the answer by hand.
Building on your own tools
The cheapest business dashboard to keep running is one built on the accounts, sheets and mailboxes you already use, rather than on a new system your team must feed.
Custom dashboard development, as we offer it, is built to order and is not yet running for a client. It is the same approach as our AI employees that are running today: the work runs on our servers against your own accounts, today Google Workspace mailboxes, Google Drive, Google Sheets and Xero, and the figures are written to sheets you own. It is rented monthly, priced per workflow in the quote. If the rental stops, the refresh stops, and every sheet and figure stays in your account.
Be clear about the limits. A dashboard shows what your systems record; if invoices are entered late, the dashboard is late. It does not decide what to do about an overdue client or a thin margin. It does not replace your accountant's view of the books, and figures used for tax or lending decisions should be checked with your adviser. It does not change anything in your systems: it reads, calculates and shows.
A sensible first business dashboard is small: five tiles, each with its question, its source and its definition written underneath. Use it for a month. The tiles nobody looks at come off; the question you kept asking that it could not answer goes on. That is how a dashboard stays useful rather than growing into a wall of figures.
The checklist on this page will help you choose your five numbers and name their sources before you build anything.
Questions
What is a business dashboard?
One screen showing the few numbers you check every week, such as sales, overdue invoices, bills due, open orders and cash, read automatically from the systems you already use.
What numbers should be on a dashboard?
Only the indicators tied to a question you ask and a decision you make. Five is a good start; more tend to be ignored.
Can I build a dashboard in a spreadsheet?
Yes, if the figures are read automatically from their sources. A spreadsheet updated by hand is wrong between updates.
What is the difference between a dashboard and a report?
A dashboard shows the current state whenever you look. A report tells you, on a set day, what changed and what needs attention. Many businesses use both.
Do I need new software for a dashboard?
Not necessarily. A dashboard can be built on your own accounting system, sheets and mailbox, with the figures written to sheets you own.
Tell us your workflow. We will build it around you.
Write to [email protected] with the five numbers you want to see and the hours you spend assembling them each month, and we will tell you plainly whether this fits.
Talk to us Related service: CRM and dashboards